The recent fracas at Jawaharlal Nehru University (JNU), followed by a pitched battle on the judicial premises, is being seen by some as part of the rising intolerance pattern. Critics attribute it to the 'aggressive' Hindu nationalist ideology of the Bharatiya Janta Party (BJP) which is at odds with intellectual freedom and dissent. Noted historian Romila Thapar expounded BJP-RSS's core ideology as "memorization of a narrow set of questions and answers" which "prohibit any doubt or deviation."
The viral images of a BJP lawmaker beating up a Left activist would seem to support this assertion. Interestingly, the fracas in the national capital coincided with the purported murder of an RSS activist by CPM workers in Kannur.
This brings me to the moot question, is violence the fief of a particular political ideology, and by extension the operationalizing political outfit? To answer this I analyze the data from the India Sub National Problem Set, which records information on violent conflicts in India until 2004. The recorded events include categories such as terrorist incidents, communal and ethnic riots, state-organized violence etc. To narrow down on the issue of political violence, I focus on incidents where at least one political outfit was involved. This sub-sample constitutes about 14% of the total recorded incidents in the dataset. In what follows I discuss the emergent patterns.
The distribution of political violence
Political violence in India, both in terms of incidence and magnitude, shows a downward trend over the sample period (Figure 1). Political violence peaked in the period from 1966 to 1970, driven by incidents involving Communist parties (see Figure 4).
Image may be NSFW.
Clik here to view.
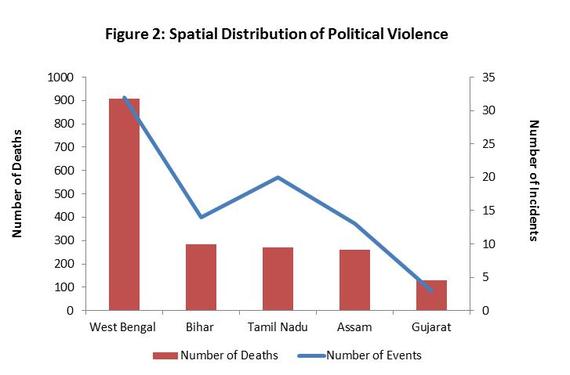
West Bengal, Assam and Tamil Nadu were most affected by political violence over the sample period. West Bengal alone accounted for over 34% of all political violence-related deaths in the sub-sample (Figure 2).
Image may be NSFW.
Clik here to view.
Which parties are associated with most violence?
Unravelling the data by political parties shows that incidents involving the BJP, Congress and CPI and CPM (Communists, henceforth) account for 74% of all deaths in the sub sample. I club the two main Communist parties together as they operationalize the same political ideology.
While the Congress was associated with greatest number of incidents, the Communists were associated with most deaths (Figure 3).
Image may be NSFW.
Clik here to view.
No clear trend emerges from the temporal profile of violence across the three political parties (Figure 4). Notably, while the violence associated with both the Congress and the Communists peaked before the 1980s, for the BJP it peaked in the 90s.
Image may be NSFW.
Clik here to view.
Is violence positively associated with political power?
On the basis of above observation I set up a testable hypothesis i.e. is political violence positively correlated with the political power enjoyed by a party? Increasing electoral success may embolden party workers to resort to violence against their opposition. In a more extreme scenario, the party in power may use institutional authority to systematically target and weaken its opposition. On the flip side, political violence may have a non-linear relationship with political power i.e. the likelihood of violence is at its maximum when the competition for political control is in balance.
To test this hypothesis I combine data on political violence with State Assembly elections data sourced from the Election Commission of India. I use State Assembly vote share as a proxy for political power. If the hypothesis holds we should expect a positive correlation between a party's vote share and the political violence associated with it. I also use squares of assembly vote shares to control for plausible non-linear relationship.
The results are presented in Table 1 at the end. The correlations are statistically insignificant, except for Congress vote share which is positively correlated with violence associated with the Communists (Column 1 and 4). This may indicate towards use of violence by the dominant political party, in retaliation to the improving electoral fortunes of its opposition.
Patterns of political violence
Three patterns emerge from the investigation of data on political violence in India. Political violence has been on a decline over the sample period. Second, West Bengal accounts for the biggest share of political violence. Finally, Congress and the Communists are associated with most political violence according to the sample.
These patterns should be seen in consonance with the caveats in the dataset. First, the data is only available till 2004. The relative share of violence associated with these parties may change if the series was updated. Second, non-treatment of certain events such as the anti-Sikh riots or Gujarat riots as political violence could be questioned, as they involved active participation of certain parties' cadres.
On a concluding note, empirical literature on political violence and political power in India is scant and could be an interesting topic for future research.
Image may be NSFW.
Clik here to view.![2016-02-19-1455922312-2628849-CorrelationMatrix.jpg]()
Image may be NSFW.
Clik here to view.![]() Like Us On Facebook |
Like Us On Facebook |
Image may be NSFW.
Clik here to view.![]() Follow Us On Twitter |
Follow Us On Twitter |
Image may be NSFW.
Clik here to view.![]() Contact HuffPost India
Contact HuffPost India
Also see on HuffPost:
The viral images of a BJP lawmaker beating up a Left activist would seem to support this assertion. Interestingly, the fracas in the national capital coincided with the purported murder of an RSS activist by CPM workers in Kannur.
Political violence peaked in the period from 1966 to 1970, driven by incidents involving Communist parties.
This brings me to the moot question, is violence the fief of a particular political ideology, and by extension the operationalizing political outfit? To answer this I analyze the data from the India Sub National Problem Set, which records information on violent conflicts in India until 2004. The recorded events include categories such as terrorist incidents, communal and ethnic riots, state-organized violence etc. To narrow down on the issue of political violence, I focus on incidents where at least one political outfit was involved. This sub-sample constitutes about 14% of the total recorded incidents in the dataset. In what follows I discuss the emergent patterns.
The distribution of political violence
Political violence in India, both in terms of incidence and magnitude, shows a downward trend over the sample period (Figure 1). Political violence peaked in the period from 1966 to 1970, driven by incidents involving Communist parties (see Figure 4).
Image may be NSFW.
Clik here to view.

West Bengal, Assam and Tamil Nadu were most affected by political violence over the sample period. West Bengal alone accounted for over 34% of all political violence-related deaths in the sub-sample (Figure 2).
Image may be NSFW.
Clik here to view.
Which parties are associated with most violence?
Unravelling the data by political parties shows that incidents involving the BJP, Congress and CPI and CPM (Communists, henceforth) account for 74% of all deaths in the sub sample. I club the two main Communist parties together as they operationalize the same political ideology.
While the Congress was associated with greatest number of incidents, the Communists were associated with most deaths (Figure 3).
Image may be NSFW.
Clik here to view.

No clear trend emerges from the temporal profile of violence across the three political parties (Figure 4). Notably, while the violence associated with both the Congress and the Communists peaked before the 1980s, for the BJP it peaked in the 90s.
Image may be NSFW.
Clik here to view.

Is violence positively associated with political power?
On the basis of above observation I set up a testable hypothesis i.e. is political violence positively correlated with the political power enjoyed by a party? Increasing electoral success may embolden party workers to resort to violence against their opposition. In a more extreme scenario, the party in power may use institutional authority to systematically target and weaken its opposition. On the flip side, political violence may have a non-linear relationship with political power i.e. the likelihood of violence is at its maximum when the competition for political control is in balance.
West Bengal, Assam and Tamil Nadu were most affected by political violence over the sample period.
To test this hypothesis I combine data on political violence with State Assembly elections data sourced from the Election Commission of India. I use State Assembly vote share as a proxy for political power. If the hypothesis holds we should expect a positive correlation between a party's vote share and the political violence associated with it. I also use squares of assembly vote shares to control for plausible non-linear relationship.
The results are presented in Table 1 at the end. The correlations are statistically insignificant, except for Congress vote share which is positively correlated with violence associated with the Communists (Column 1 and 4). This may indicate towards use of violence by the dominant political party, in retaliation to the improving electoral fortunes of its opposition.
Patterns of political violence
Three patterns emerge from the investigation of data on political violence in India. Political violence has been on a decline over the sample period. Second, West Bengal accounts for the biggest share of political violence. Finally, Congress and the Communists are associated with most political violence according to the sample.
These patterns should be seen in consonance with the caveats in the dataset. First, the data is only available till 2004. The relative share of violence associated with these parties may change if the series was updated. Second, non-treatment of certain events such as the anti-Sikh riots or Gujarat riots as political violence could be questioned, as they involved active participation of certain parties' cadres.
On a concluding note, empirical literature on political violence and political power in India is scant and could be an interesting topic for future research.
Image may be NSFW.
Clik here to view.
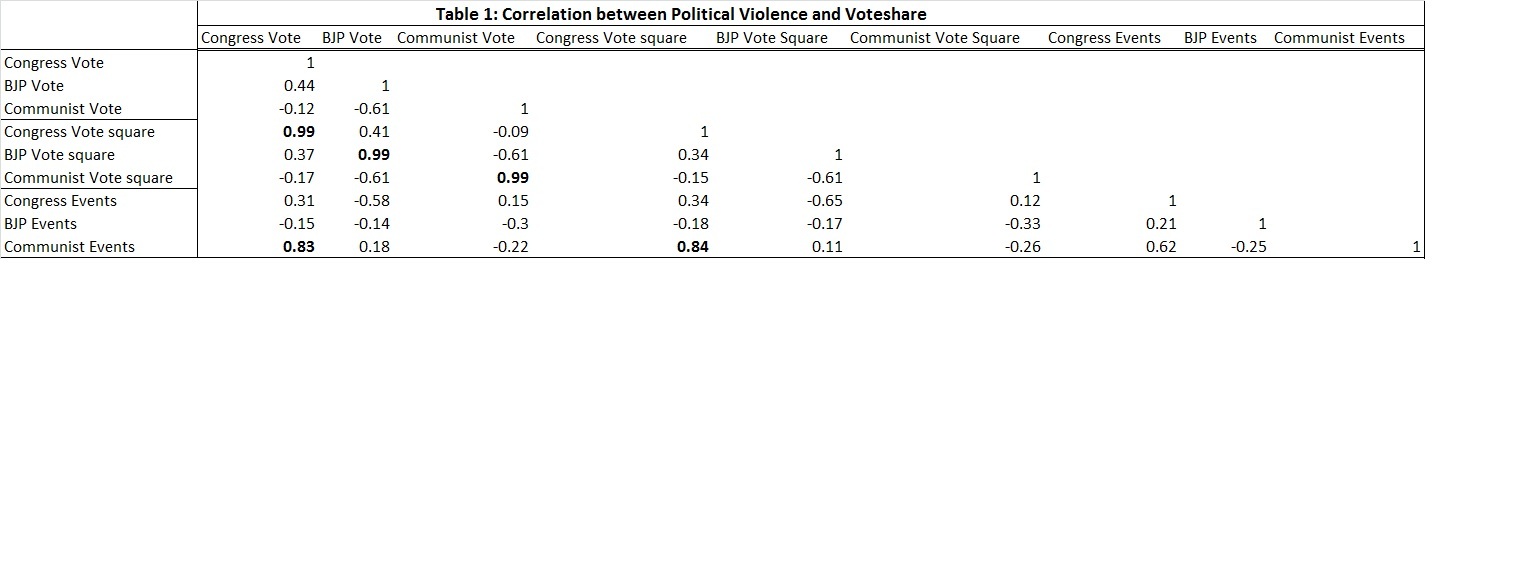
Image may be NSFW.
Clik here to view.
 Like Us On Facebook |
 Image may be NSFW.
Clik here to view.
 Follow Us On Twitter |
 Image may be NSFW.
Clik here to view.
Also see on HuffPost: